Depreciation rates are generally based on the effective life of an asset, unless a write-off rate is prescribed for some other purpose, such as the small business incentives.
The effective life is the number of years an asset is estimated to be useful.
Depreciation deductions for each tax year are based on an allocation of the asset cost to each year.
Thus calculating depreciation for an asset requires a useful life estimate, and the Tax Office each year provides an updated annual list of assets and their determined effective lives.
Look up the list of useful lives of individual assets (in years) from the official ruling here:
ATO’s Effective Life Depreciation Rates 2023 Ruling TR 2022/1
click image to start asset search. If the search box doesn’t appear, refresh this page.
How long an asset is considered to last, its “useful life“, determines the rate for deducting part of its cost each year.
Once you have the useful life in years, head over and get the spreadsheet calculator to convert effective life to a percentage depreciation rate.
There are several ways in which the rate of depreciation for a particular asset might be determined:
- some kinds of assets have a prescribed depreciation rate – a number of those are set out here.
- you make a self-assessment – this your own estimate of effective life based on features of the asset and the way it is used; or
- you use a determination of effective life for which tables are updated and published annually by the Tax Office (see discussion below).
The ATO makes its determination of effective life for different kinds of assets after research into how long it will take the asset to wear out according to an assumed usage level.
The effective life, measured in years, will naturally depend on the kind of asset, how it is used and the conditions under which it is used.
Ato depreciation rate tools and and lookup tables
On this page
- How the depreciation deduction is calculated
- Three ways to calculate effective life
- Tax Office’s Effective Life Rulings
- How to use the effective life tables
- Locating assets in the tables
- Calculate: Convert effective life to percentage rate
- Convert effective life spreadsheet
- Depreciation calculation methods
How the depreciation deduction is calculated
For a depreciation claim, the effective life in years is converted to an annual percentage rate, based on one of the two depreciation methods outlined below, or using the effective life conversion spreadsheet at the foot of this page.
When the percentage rate is applied to the cost, or remaining cost, of an asset the dollar amount calculated the deductible depreciation amount.
3 Ways To Get Depreciation Rates
- Search for the asset by name using the Commissioner of Taxation’s published rate on the ATO’s online asset lookup tool. Use the ATO’s online effective life lookup tool here
- Here’s another online tool which is easy to use and based on the effective life ruling. See the Free Australian Tax Depreciation Rate Finder here.
- Download the effective life Ruling (pdf) and perform a document search (explained in detail here). That will give you the effective life in years which can be converted to a percentage rate manually, or using the spreadsheet below.
The Commissioner of Taxation’s Effective Life Schedules (Rulings)
When choosing to use the Commissioner’s estimate of useful life ensure that the schedule chosen is applicable to the year the asset was acquired.
Commissioner’s Effective Life Tables
| Tax Year | Ruling (download links) |
| 2022-23 | TR 2022/1(html) |
| 2021-22 | TR 2021/3 |
| 2020-21 | TR 2020/3 |
| 2019-20 | TR 2019/5 |
| 2018-19 | TR 2018/4 |
| 2017-18 | TR 2017/2 |
| 2016-17 | TR 2016/1 |
| 2015-16 | TR 2015/2 |
| 2014-15 | TR 2014/4 |
| 2013-14 | TR 2013/4 |
| 2012-13 | TR 2012/2 |
| 2011-12 | TR 2011/2 |
The applicable Ruling for an asset is the one covering the period in which the asset was acquired.
How to use the effective life tables
The Effective Life Tables are supplied in downloadable PDF documents which are searchable using your computer browser or a software viewer such as Adobe.
To manually locate assets from the tables in a pdf document use the search function (usually CRTL+F) on your keyboard as follows.
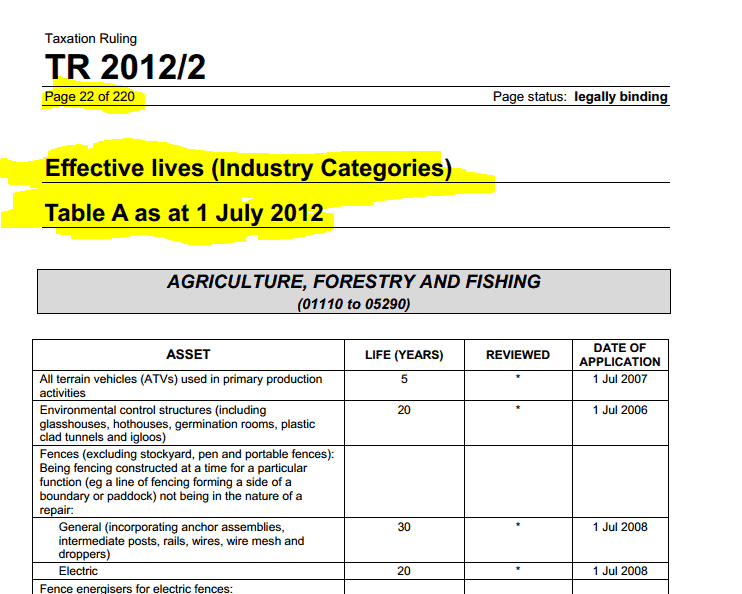
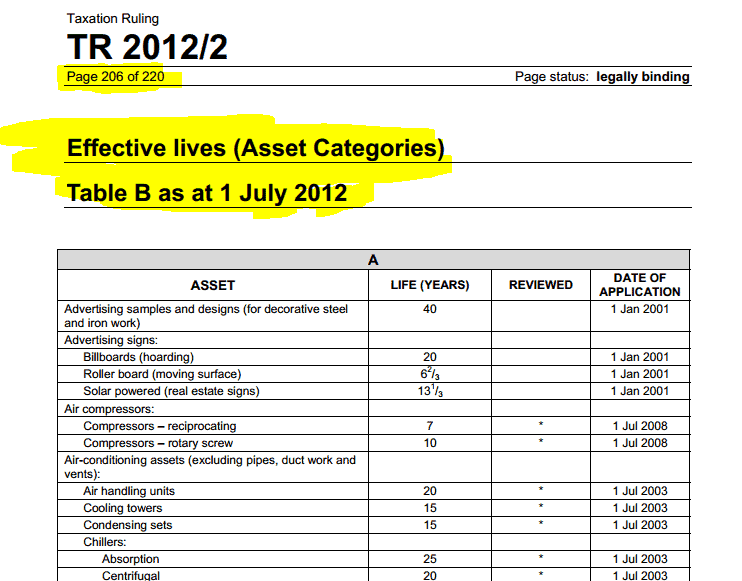
There are two effective life schedules or tables, referred to as Table and Table B.
Depreciation rate: Locating assets in the tables
The PDF formatted versions of the Commissioner’s effective life tables can be viewed in your browser or Adobe Acrobat Reader (or a similar reader) and are searchable for specific text.
To search the document, use ctrl+f on the keyboard. The procedure is as follows:
- Step 1. Search Table A first. If the asset is not in Table A, then..
- Step 2. Search Table B. If the asset also can’t be found in Table B, then..
- Step 3. the self-assessment method of determining effective life must be used.
Once an asset’s effective life (in years) is found, to calculate depreciation requires conversion to a percentage rate. See next:
Calculate: Convert effective life to percentage rate
Having found an asset under the industry listing (Table A) or in Table B, the Effective Life tables provide a single number. That number is the Commissioner’s estimate of effective life in years.
That determination in years forms the basis of a depreciation calculation which allocates the asset cost over the years of its useful life. That cost allocation is the nominal deduction. (Only “nominal”, because if the asset has some private use for example, some further adjustment may be required).
Based on a useful life measured in years, there are then two possible depreciation calculation methods:
Depreciation calculation methods
There’s a choice of two methods: Diminishing Value, and Prime Cost:
Diminishing Value Method
The diminishing value method results in higher depreciation claim amounts in the earlier years of asset ownership.
For assets from on or after 10 May 2006 the formula is:
Base Value x (Days held ÷ 365) x (200% ÷ Effective life in years)
The term ‘Base Value’ is initially cost, but this can be modified by later improvements and the forgiveness of commercial debts. Under the Diminishing Value method, the depreciation for each successive year is calculated on the Base Value reduced by the previous year’s claim amount.
(N.B. For assets before 10 May 2006, 200% in the above formula is substituted by 150%)
Prime Cost Method
The Prime Cost method allocates the costs evenly over the years of ownership. The formula:
Cost x (Days held ÷ 365) x (100% ÷ Effective life in years)
The Cost and calculation may be later modified by a recalculation of effective life, later improvements, forgiveness of commercial debts, application of rollover relief, GST and currency adjustments.
Note also that where motor vehicles are concerned, luxury cars have an upper depreciable cost limit.
Converting Effective Life to the percentage depreciation rate – spreadsheet calculator
If you need a hand with the conversion of effective life in years to a depreciation percentage, we’ve built a simple spreadsheet in MS Excel which does the job.
The calculator converts number of years to a depreciation percentage rate so you can get an actual depreciation claim amount in dollars. You can also see the comparison between the Diminishing Value and Prime Cost calculation methods.
You can get the Effective Life calculator spreadsheet here ($1.97):
You can get the Effective Life calculator spreadsheet here ($1.97):

Price: $1.97

Immediate download: On completion of payment your browser will be sent to a download link, and an email containing the link will be sent to your payment address.
See also
This page was last modified 2021-06-30